Introduction
OpenTelemetry is widely adopted in the observability space and has become an essential tool for monitoring applications and infrastructure. When introducing OpenTelemetry, the OpenTelemetry Collector is often used to collect, process, and forward telemetry data.
When operating the OpenTelemetry Collector, it is important to verify in advance how much load it can withstand. This article introduces how to perform a simple load test of the OpenTelemetry Collector using telemetrygen.
Prerequisites
The versions of the tools used in this article are as follows.
The configuration files used are stored in the following repository.
telemetrygen
telemetrygen is a tool that can simulate clients generating traces, metrics, and logs. For example, you can generate metrics data by running the following command.
$ telemetrygen metrics --duration 1s --otlp-insecureYou can check the other options by running telemetrygen --help.
$ telemetrygen --help

Telemetrygen simulates a client generating traces, metrics, and logs

Usage:
  telemetrygen [command]

Examples:
telemetrygen traces
telemetrygen metrics
telemetrygen logs

Available Commands:
  help        Help about any command
  logs        Simulates a client generating logs. (Stability level: Development)
  metrics     Simulates a client generating metrics. (Stability level: Development)
  traces      Simulates a client generating traces. (Stability level: Alpha)

Flags:
  -h, --help   help for telemetrygen

Use "telemetrygen [command] --help" for more information about a command.
Each subcommand has options such as --duration, --rate, and --workers, which you use to perform load testing.
You can also add custom attributes such as Attributes, so you can run load tests in a form closer to your actual application.
Building the verification environment
The OpenTelemetry Collector pipeline is configured as follows.
# ...
service:
  telemetry:
    metrics:
      address: ":8888"
  pipelines:
    logs:
      receivers: [otlp]
      processors: [memory_limiter, batch]
      exporters: [debug]
    metrics:
      receivers: [otlp]
      processors: [memory_limiter, batch]
      exporters: [debug]
    traces:
      receivers: [otlp]
      processors: [memory_limiter, batch]
      exporters: [debug]
Since we use the OpenTelemetry Collector along with Prometheus and Grafana for monitoring, we build the execution environment using Docker Compose.
services:
  otelcol:
    image: ghcr.io/open-telemetry/opentelemetry-collector-releases/opentelemetry-collector-contrib:0.107.0
    ports:
      - "4317:4317"
      - "4318:4318"
      - "8888:8888"
      - "30001:30001"
    volumes:
      - ./config.yaml:/etc/otelcol-contrib/config.yaml
    deploy:
      resources:
        limits:
          cpus: '0.25'
          memory: '256M'
        reservations:
          cpus: '0.1'
          memory: '256M'

  prometheus:
    image: prom/prometheus
    ports:
      - "9090:9090"
    volumes:
      - ./prometheus.yaml:/etc/prometheus/prometheus.yaml
    command: "--config.file=/etc/prometheus/prometheus.yaml"
    restart: always

  grafana:
    image: grafana/grafana
    depends_on:
      - prometheus
    volumes:
      - ./dashboards:/var/lib/grafana/dashboards
      - ./dashboard.yaml:/etc/grafana/provisioning/dashboards/dashboard.yaml
      - ./datasource.yaml:/etc/grafana/provisioning/datasources/datasource.yaml
    ports:
      - "3000:3000"
    restart: always
Use the Docker Compose file above to start the OpenTelemetry Collector, Prometheus, and Grafana containers.
$ docker-compose upLoad testing the OpenTelemetry Collector
In the verification environment we built, we will load-test the OpenTelemetry Collector using telemetrygen. Here we proceed with an example of sending traces as the load test, but you can perform load tests in the same way for metrics and logs.
First, let's run the OpenTelemetry Collector with resources limited to CPU: 0.25 and memory: 256M.
$ telemetrygen traces --otlp-insecure --duration 10s --rate 500 --workers 10Running the command above sends trace data at 500 spans/sec for 10 seconds using 10 workers.
After running the command, when we check the OpenTelemetry Collector metrics in Grafana, we can see that trace data is received and that Refused and Dropped gradually increase.
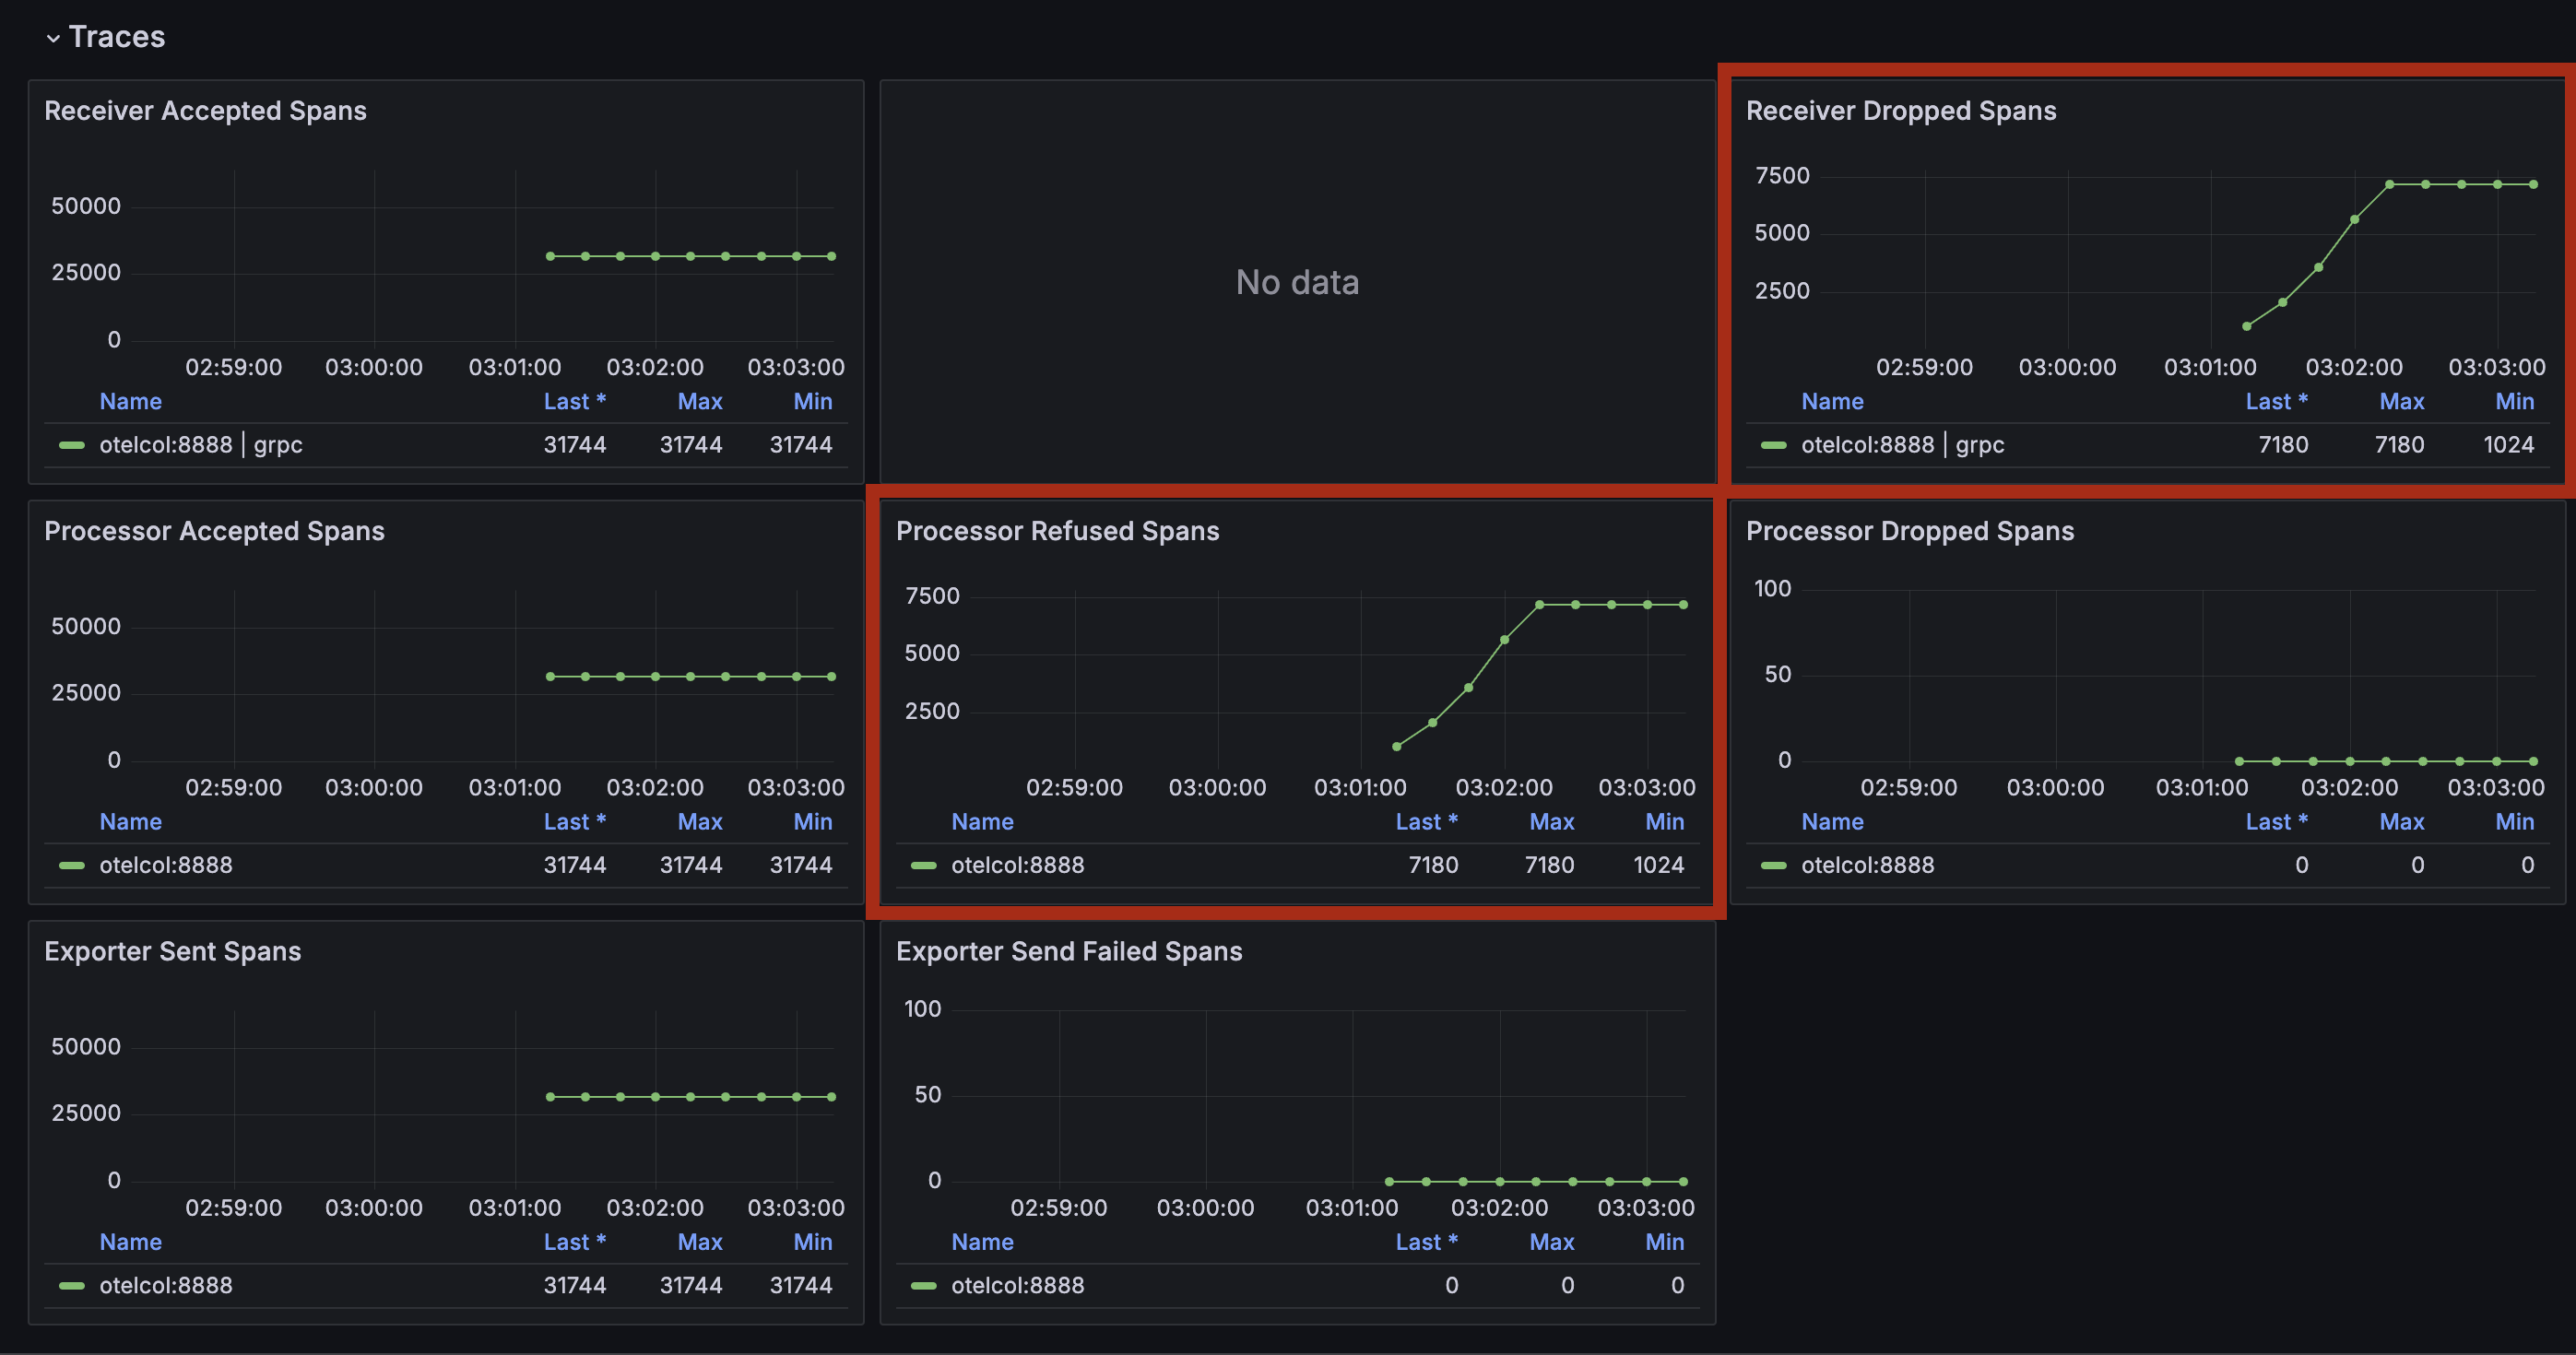
Looking at the telemetrygen logs, we can see that memory usage became high and data was refused.
traces export: context deadline exceeded: rpc error: code = Unavailable desc = data refused due to high memory usageBecause the OpenTelemetry Collector configuration uses memory_limiter, data is rejected when memory usage gets high, which is considered the cause. Ideally, you should also check the metrics of the execution environment, but that is omitted here.
Next, we send trace data to the OpenTelemetry Collector with resources limited to CPU: 1 and memory: 1G.
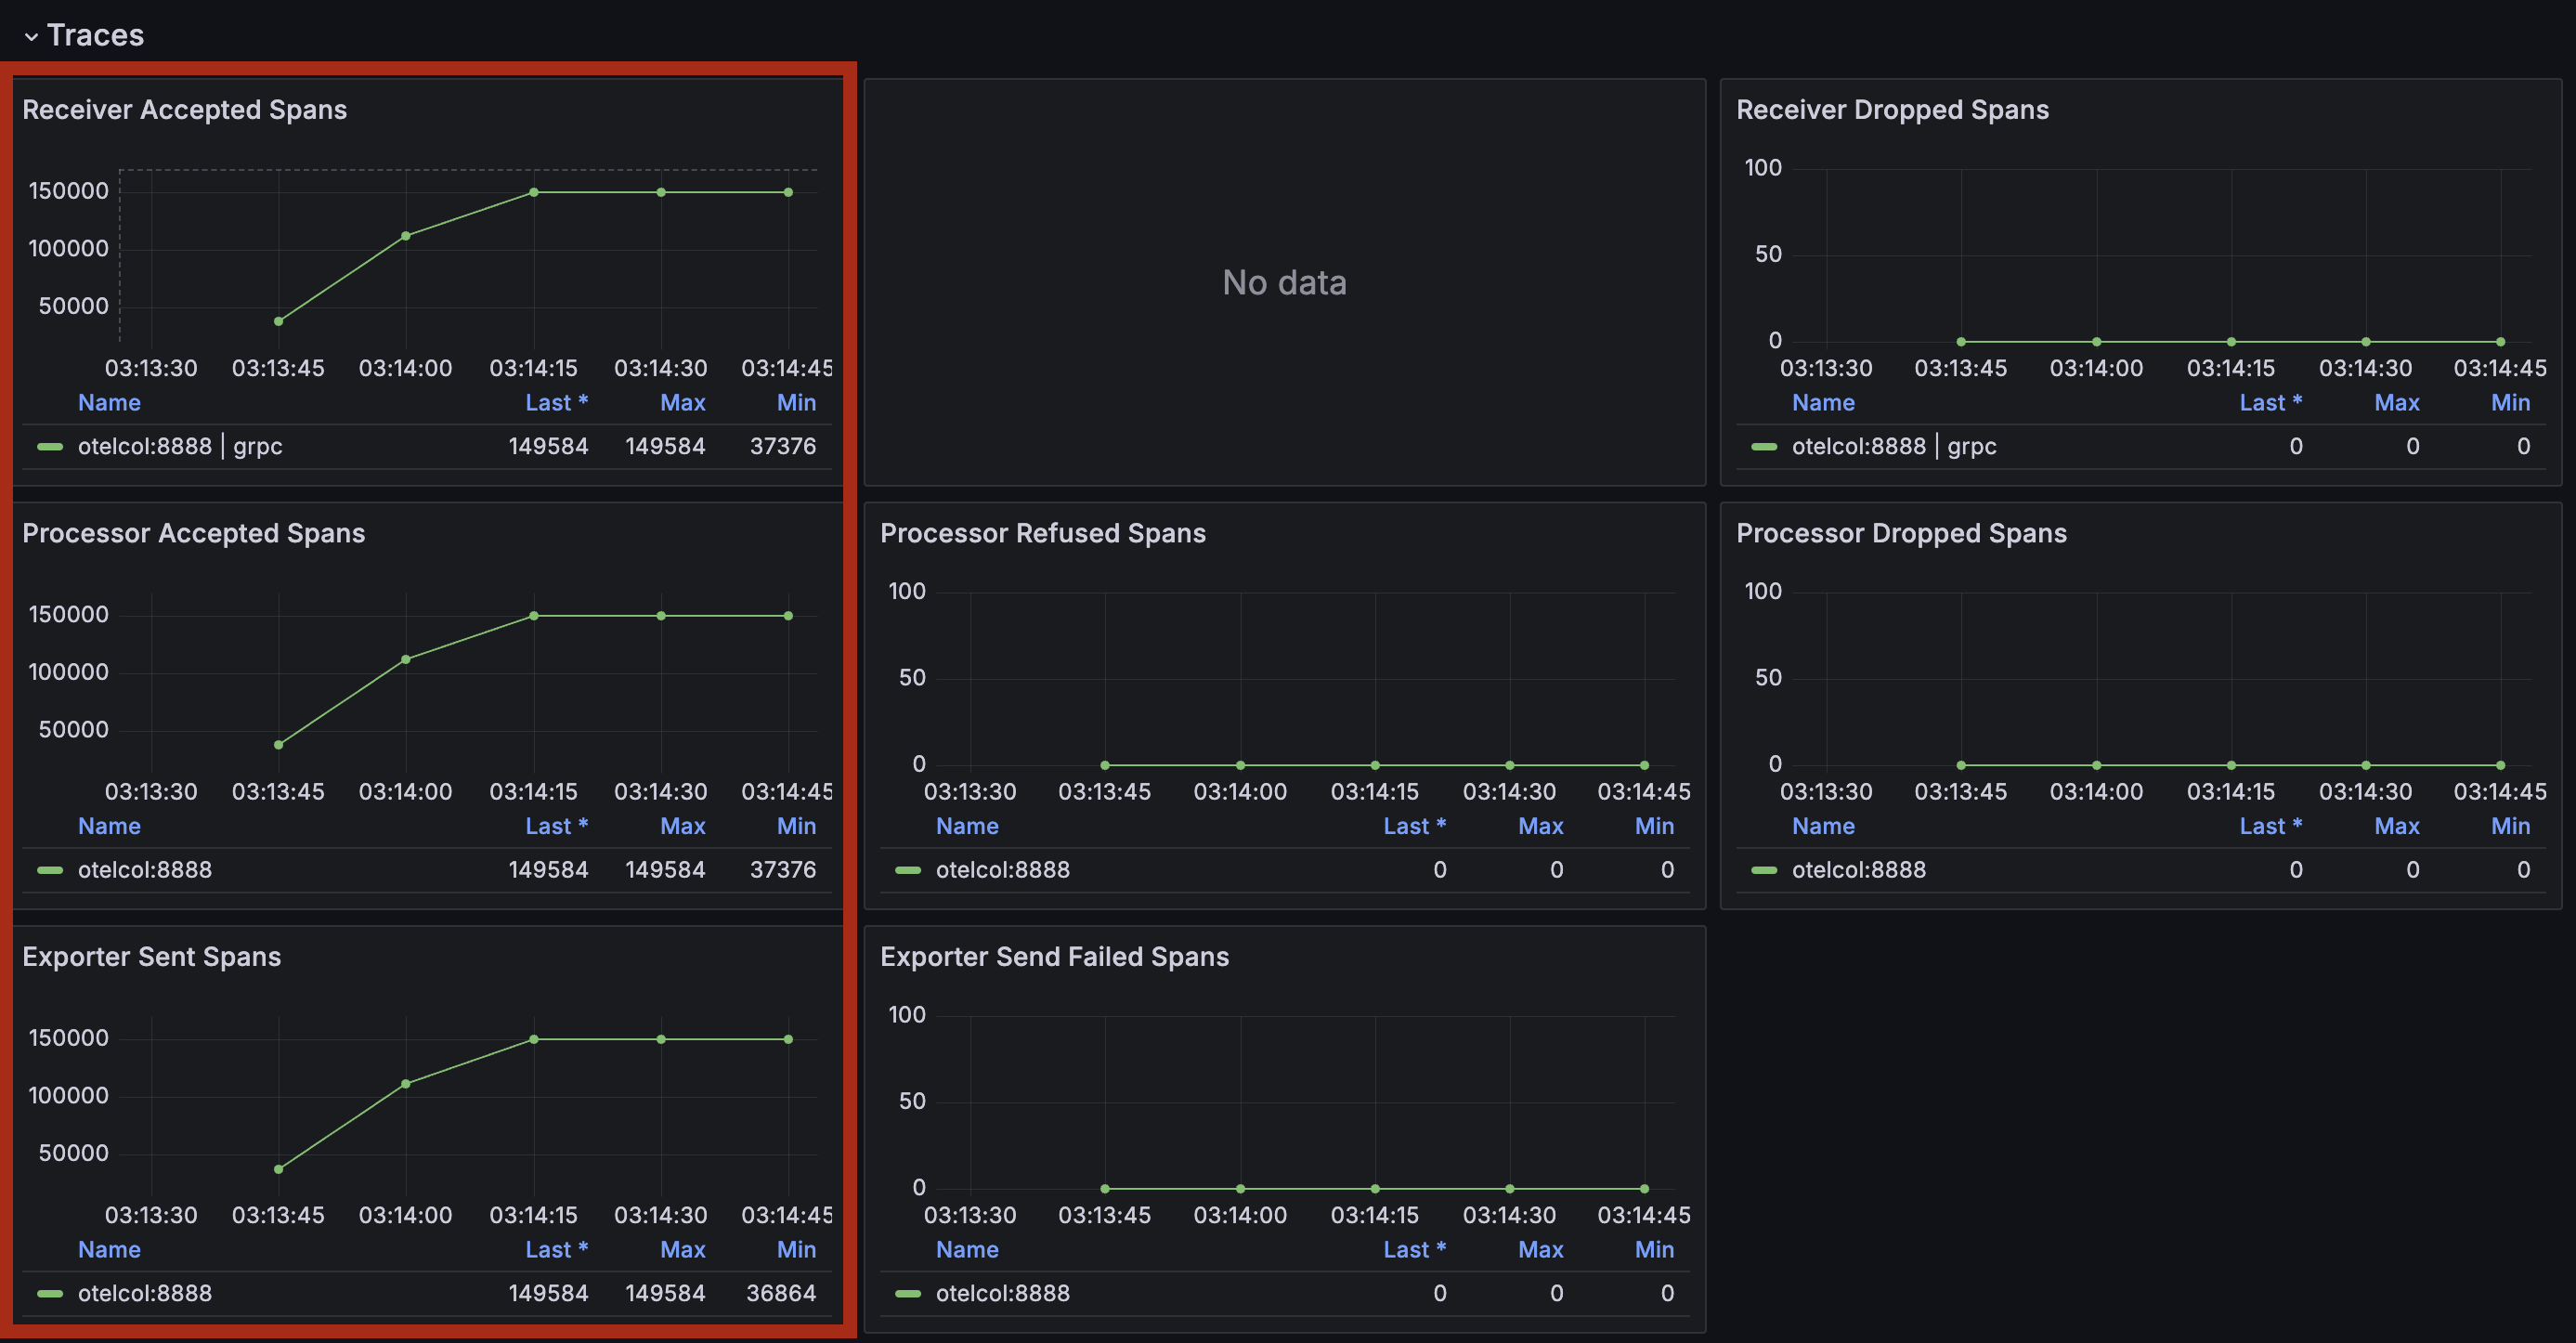
After running the command, checking the OpenTelemetry Collector metrics in Grafana shows that Refused and Dropped do not increase and that data is being received normally.
Conclusion
This article introduced how to load-test the OpenTelemetry Collector using telemetrygen. When load-testing the OpenTelemetry Collector, you can easily perform load testing by using telemetrygen.
Although we did not perform customizations such as adding Attributes this time, we recommend running load tests in a form closer to the telemetry data that your actual application emits.
If there is anything explained or expressed incorrectly in this article, please let me know.