Introduction
This article is the 19th day entry of the CyberAgent Group SRE Advent Calendar 2025.
In Datadog, you can use OpenTelemetry for instrumentation in addition to dd-trace, but features that worked seamlessly when using dd-trace-go may not work simply by adopting OpenTelemetry as is. In that case, you need to fill in some implementation yourself to make Datadog and your application work well together.
In this article, I will explain how to enable Endpoint Profiling when using the Datadog Profiler in an application that does not use dd-trace-go.
Prerequisites
This article assumes the following package versions.
- dd-trace-go: v1.72.2
What is Endpoint Profiling?
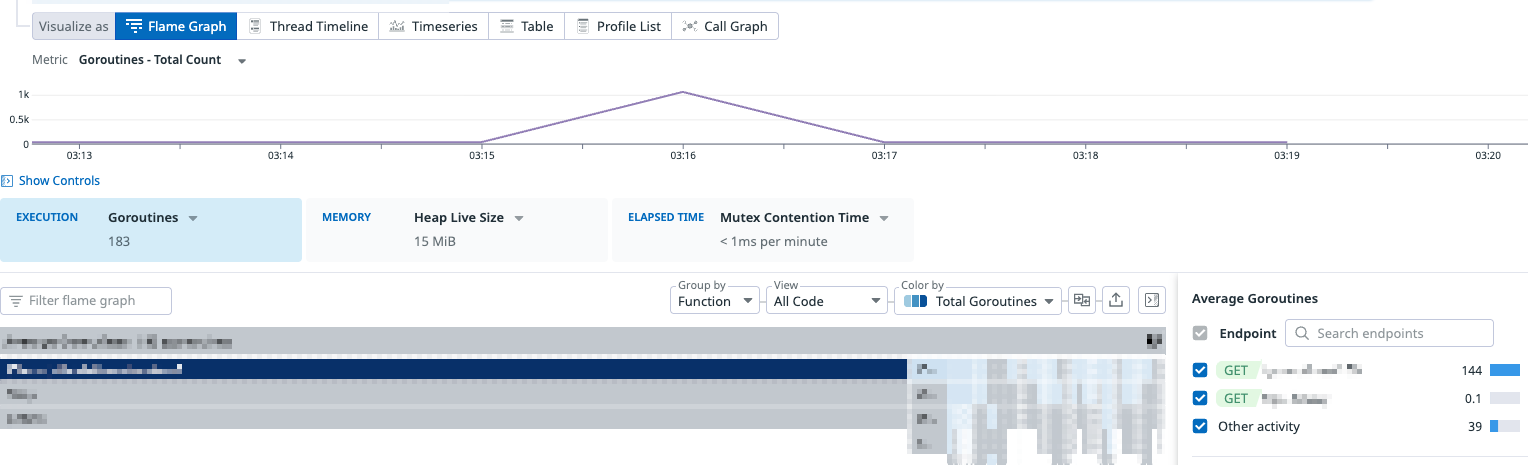
Endpoint Profiling is one of the features of the Datadog Profiler. It is a feature that lets you narrow down the scope of the profile flame graph to an arbitrary endpoint of a web service (e.g. HTTP Endpoint / gRPC Method) and analyze profile data related to that specific endpoint in detail.
By analyzing profile data per endpoint, you can eliminate noise from endpoints other than the one you are investigating, making it easier to identify performance issues and bottlenecks occurring on a specific endpoint.

As shown in the image above, you can filter profile data by endpoint on the Datadog Profiler UI and analyze profile data related to a specific endpoint in detail.
However, when you adopt the Datadog Profiler in an application instrumented with OpenTelemetry, the Endpoint Profiling feature is not enabled by default. This is because it depends on pprof labels that are automatically set during dd-trace-go's trace instrumentation.
How dd-trace-go implements Endpoint Profiling
When using dd-trace-go for instrumentation, Endpoint Profiling is enabled automatically. Endpoint Profiling is realized by attaching endpoint information to profile data using the label feature provided by Go's runtime/pprof package.
Attaching pprof labels
The pprof labels introduced in Go 1.9 are a mechanism to attach arbitrary key-value pairs to profile samples. When the CPU profiler takes a sample, the labels currently set on the goroutine are automatically recorded with the sample.
import "runtime/pprof"

func handleRequest(w http.ResponseWriter, r *http.Request) {
    // Set labels on the goroutine
    labels := pprof.Labels("endpoint", "GET /users")
    ctx := pprof.WithLabels(r.Context(), labels)
    pprof.SetGoroutineLabels(ctx)

    // CPU time consumed by this goroutine is sampled
    // with the label "endpoint=GET /users"
    doWork()

    // Restore the parent labels
    pprof.SetGoroutineLabels(r.Context())
}
Label propagation
What is important about pprof labels is that labels are set per goroutine. Therefore, when starting child goroutines, you need to explicitly carry over the labels.
ctx := pprof.WithLabels(parentCtx, pprof.Labels("key", "value"))
pprof.SetGoroutineLabels(ctx)

go func() {
    // Set labels on this goroutine as well
    pprof.SetGoroutineLabels(ctx)
    // ...
}()
How the Datadog Profiler uses labels
The Datadog Profiler interprets specific keys among the labels of the collected pprof profile as endpoint identifiers and displays them as the Endpoint filter on the UI. dd-trace-go automatically sets these labels when starting a Span.
func (t *tracer) StartSpan(operationName string, options ...StartSpanOption) *Span {
	// ... omitted ...
	if t.config.internalConfig.ProfilerHotspotsEnabled() || t.config.internalConfig.ProfilerEndpoints() {
		t.applyPPROFLabels(span.pprofCtxRestore, span)
	} else {
		span.pprofCtxRestore = nil
	}
	// ... omitted ...
}

func (t *tracer) applyPPROFLabels(ctx gocontext.Context, span *Span) {
	// ... omitted ...
	if t.config.internalConfig.ProfilerEndpoints() && localRootSpan != nil {
		localRootSpan.mu.RLock()
		if spanResourcePIISafe(localRootSpan) {
			labels = append(labels, traceprof.TraceEndpoint, localRootSpan.resource)
			if span == localRootSpan {
				// Inform the profiler of endpoint hits. This is used for the unit of
				// work feature. We can't use APM stats for this since the stats don't
				// have enough cardinality (e.g. runtime-id tags are missing).
				traceprof.GlobalEndpointCounter().Inc(localRootSpan.resource)
			}
		}
		localRootSpan.mu.RUnlock()
	}
	if len(labels) > 0 {
		span.pprofCtxRestore = ctx
		span.pprofCtxActive = pprof.WithLabels(ctx, pprof.Labels(labels...))
		// :NOTE: pprof labels are set here
		pprof.SetGoroutineLabels(span.pprofCtxActive)
	}
}
The pprof label key is defined as follows.
// pprof labels applied by the tracer to show up in the profiler's profiles.
const (
    // ...
	TraceEndpoint   = "trace endpoint"
)
By setting pprof labels using this label name, you can use the Datadog Profiler's Endpoint Profiling feature even when not performing trace instrumentation with dd-trace-go.
trace endpoint label is defined as a private package inside dd-trace-go, and I could not find anything explicitly stated as Datadog's public specification. Therefore, be aware that it may change in future versions.Enabling Endpoint Profiling without dd-trace-go instrumentation
There are several ways to set the trace endpoint label, such as setting it in a Span Processor or in a Middleware / Interceptor.
Here, as an example, I will introduce how to set labels in a Middleware / Interceptor.
Setting labels in HTTP server middleware
Here is an example of setting pprof labels in middleware for an HTTP server using gorilla/mux.
In the middleware function, we obtain the route pattern of the request and set the pprof labels.
package main

import (
    "net/http"
    "runtime/pprof"

    "github.com/gorilla/mux"
)

const (
    traceEndpoint   = "trace endpoint"
)

func middleware(next http.Handler) http.Handler {
    return http.HandlerFunc(func(w http.ResponseWriter, r *http.Request) {
        endpoint := getRoutePattern(r)
        if endpoint == "" {
            next.ServeHTTP(w, r)
            return
        }

        // Set pprof labels
        labels := pprof.Labels(traceEndpoint, endpoint)
        ctx := pprof.WithLabels(r.Context(), labels)
        pprof.SetGoroutineLabels(ctx)

        // Restore labels at the end of the request
        defer pprof.SetGoroutineLabels(r.Context())

        next.ServeHTTP(w, r.WithContext(ctx))
    })
}

func getRoutePattern(r *http.Request) string {
    route := mux.CurrentRoute(r)
    if route == nil {
        return ""
    }
    pathTemplate, err := route.GetPathTemplate()
    if err != nil {
        return ""
    }

    return r.Method + " " + pathTemplate
}
Setting labels in a gRPC Unary Server Interceptor
Here is an example of setting pprof labels in a Unary Server Interceptor of a gRPC server. In the interceptor function, we obtain the gRPC method name and set the pprof labels.
package main
import (
"context"
"runtime/pprof"
"google.golang.org/grpc"
)
const (
traceEndpoint = "trace endpoint"
)
func interceptor() grpc.UnaryServerInterceptor {
return func(ctx context.Context, req any, info *grpc.UnaryServerInfo, handler grpc.UnaryHandler) (any, error) {
// Set pprof labels
// `info.FullMethod` has the form like `/echo.EchoService/Echo`
endpoint := info.FullMethod
pprofCtx := pprof.WithLabels(ctx, pprof.Labels(
traceEndpoint, endpoint,
))
pprof.SetGoroutineLabels(pprofCtx)
// Restore labels at the end of the request
defer pprof.SetGoroutineLabels(ctx)
return handler(pprofCtx, req)
}
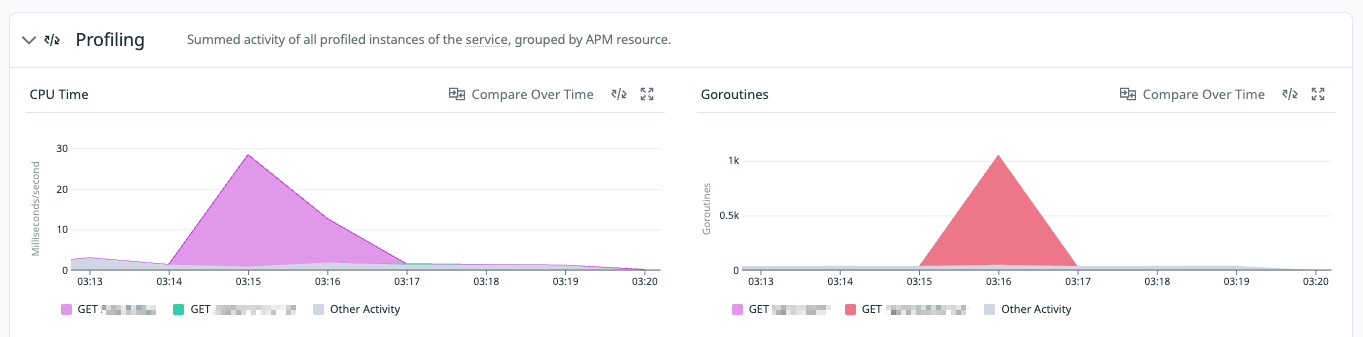
}By incorporating these implementations, you will be able to filter by endpoint on the Profiler UI, and on the Profiling tab of the Service Catalog the profile data will be displayed color-coded by endpoint.
Profiler UI
Service Catalog Profiler Tab
Caveats when setting labels in Middleware / Interceptor
The methods introduced are effective for profiling at the granularity of HTTP / gRPC requests, but because pprof labels are set per goroutine, when you start new goroutines inside a handler or delegate processing to a worker pool or background job, the labels are not automatically carried over to child goroutines.
As a result, even for processing originating from an endpoint, the CPU time consumed in asynchronous goroutines may appear in Endpoint Profiling as samples not associated with any endpoint.
If you want to measure including asynchronous processing, you need to do things like explicitly calling pprof.SetGoroutineLabels again on the goroutine you start.
Conclusion
This article explained how to enable Datadog Profiler's Endpoint Profiling for applications not instrumented with dd-trace-go. The Datadog Profiler's Endpoint Profiling feature is very useful for analyzing in detail the profile data related to a specific endpoint. By setting pprof labels appropriately, you can take advantage of this feature even in cases where dd-trace-go is not used, such as with OpenTelemetry.
In addition, since Datadog also seems to use pprof labels for correlating Profiler and Trace, although it is unverified, it is possible that this can be achieved with the same approach. If anyone is interested, I would be happy if you try it and share the results.
If there is anything explained or expressed incorrectly in this article, please let me know.